Motor Life: Not a Simple Concept
How long will a motor last?
It depends on what the meaning of the word "last" is: by Richard L. Nailen EA Engineering Editor
Adapted and summarized from “Motor Life: Not a Simple Concept,” Electrical Apparatus Magazine, December 2019.
Fast Facts: Quick Takeaways
- Average Motor Failure Rate: ~10% per year (combining mechanical and electrical causes)
- Top Failure Cause: Bearings (over 50% of failures)
- Motor Life by HP: Motors above 50 HP last significantly longer
- Rewinding Does Not End Life: Proper rewinding maintains efficiency
- Biggest Life Factors: Environment, maintenance, load management
- Efficiency vs Reliability: No significant reliability difference between standard and premium-efficiency motors
Introduction
How long will a motor last? It depends on what "lasting" means. Motor life is a complex topic shaped by numerous factors beyond simple operating hours.
A 1959 IEEE report published failure rates for a variety of electrical apparatus, including induction motors up to 200 horsepower. It showed an average annual failure rate around 10%, divided between electrical causes (3–4%) and mechanical causes (about 7%). Despite extensive studies over decades, predicting the life span of any individual motor remains elusive.
Understanding Motor Failure
Motor failure does not necessarily signal the end of a motor’s useful life. Motors often experience breakdowns that are repairable, meaning they can continue operating long after initial failure events.
Key Causes of Motor Failure:
- Bearings (largest cause)
- Winding failures
- Environmental stresses (voltage, moisture, contaminants)
- External mechanical damage
- Unknown or multiple factors
A failure may merely trigger a repair—not total retirement of the motor. In fact, bearing replacement is cited as the most common reason motors enter the repair shop and is far less costly and time-consuming than rewinding.
Failure vs. End of Life
"Motor life" and "first failure" are not interchangeable concepts. Many motors can be repaired multiple times before actual retirement.
The true "end of life" is better defined by economics:
- When the cost of repair outweighs the value of continued operation.
- When replacement offers better long-term reliability and cost efficiency.
Proper repairs (especially rewinding) do not automatically shorten a motor's life or compromise efficiency when conducted to best-practice standards.
Factors Influencing Motor Life
Motor longevity is heavily influenced by a combination of factors:
- Operating Environment: Exposure to dust, heat, moisture, vibration, and chemical agents.
- Maintenance Quality: Timely bearing lubrication, alignment, insulation monitoring, and cooling management.
- Motor Design and Materials: Original manufacturing quality and materials durability.
- Installation Practices: Correct sizing, alignment, and connection methods.
- Duty Cycle and Loading: Continuous overloads, frequent starts/stops, and harsh service conditions shorten life.
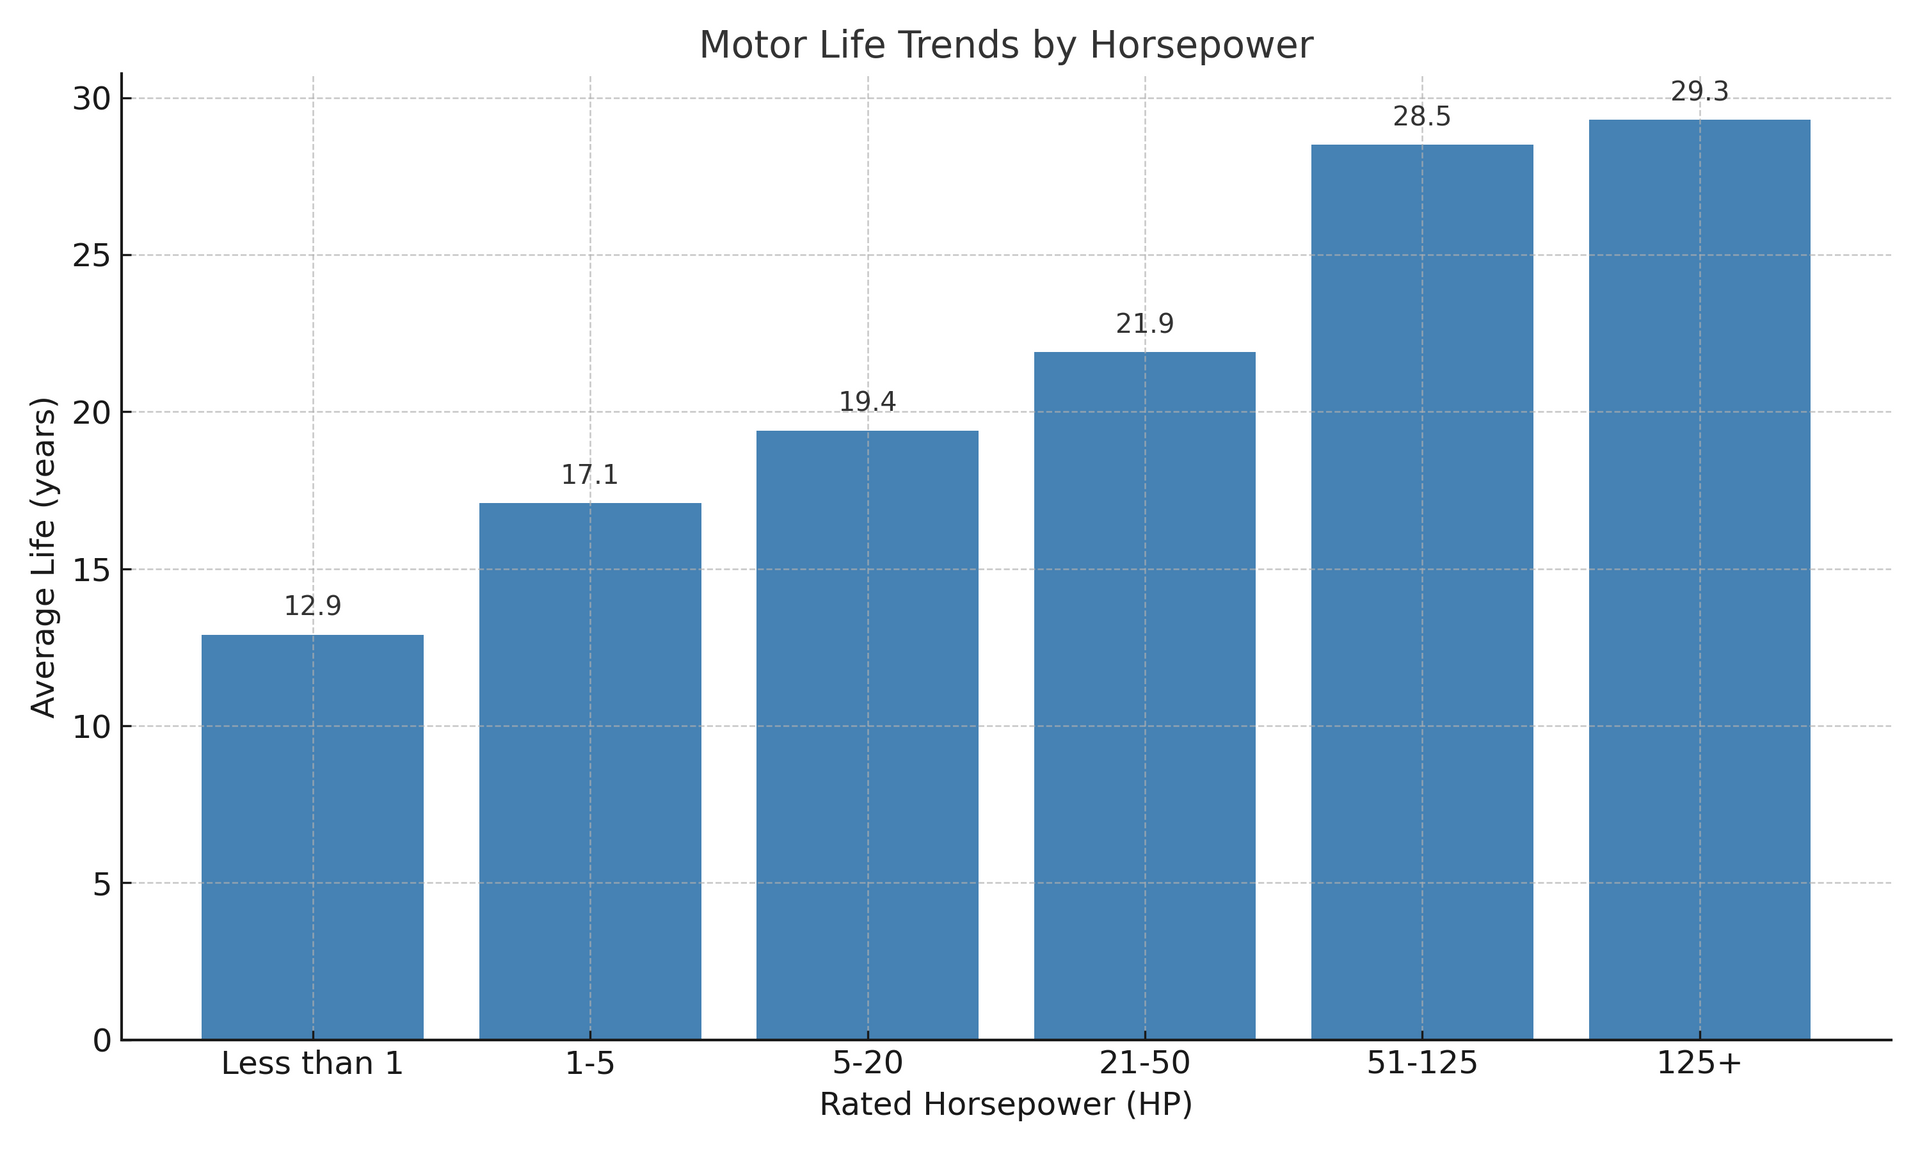
Motor Life Trends by Horsepower
Surveys and studies, including U.S. Department of Energy and IEEE data, suggest that motor life expectancy correlates with motor size:
Please see below table
Observation: Larger motors tend to have a longer average service life, partly due to sturdier designs and more careful maintenance practices.
Impact of Rewinding and Repairs
A common misconception is that a motor’s life ends with its first rewind.
In reality:
- Properly rewound motors can maintain efficiency and reliability.
- Industry studies (e.g., EASA/ANSI standards) show minimal efficiency loss when rewinding is performed correctly.
Graphs such as Figure 4 in the original publication demonstrate that performance deterioration is more dependent on poor repair practices than on the act of rewinding itself.
Motor Efficiency vs. Reliability
With the rise of energy-efficient motor designs, concerns emerged about whether “new” motors sacrifice longevity for higher efficiency.
Studies consistently show that, when comparing motors built to similar quality standards and operated under proper conditions:
- There is no significant reliability gap between traditional and premium-efficiency motors.
- Failures are more often due to operational and maintenance conditions, not motor design compromises.
Defining True "End of Life"
End of life for motors should be evaluated based on:
- Percentage of motors reaching true worn-out condition.
- Operating environment uniformity across surveyed populations.
- Installation consistency.
"Motor life" should not be defined solely by "time to first failure," but by comprehensive serviceability and cost-effectiveness.
Common Misunderstandings About Motor Life
- Motor failure does not equal motor end of life.
- Time to first failure is not an accurate measure of motor lifespan.
- Manufacturer life claims (like 20+ years) often lack rigorous experimental backing and depend heavily on environment and maintenance.
Key Practical Insights:
- Motors operated part-time or lightly loaded often last far longer than continuous full-load motors.
- Maintenance discipline remains the most reliable method to extend motor life.
- Knowing "how long" is less important than knowing how to maintain and when replacement makes more sense than repair.
Conclusion
Motor life is not a simple, fixed figure.
It depends on:
- The operating conditions
- Maintenance practices
- Economic evaluations
Rather than relying solely on theoretical life ratings, organizations should focus on proactive maintenance, careful repairs, and informed replacement strategies to optimize motor service life.
Motor longevity is, ultimately, a combination of engineering, economics, and maintenance discipline.
Appendix: Key Figures & Graphs
1. Causes of Motor Failure:
- Bearings – 51%
- Winding – 16%
- External environment (voltage, moisture, etc.) – 16%
- Unknown – 10%
- Rotor – 5%
- Shaft/Coupling – 2%
2. Motor Life by Horsepower Table: (See Motor Life Trends by Horsepower section above)
3. Efficiency After Rewinds:
- Proper rewinding maintains original motor efficiency if best practices are followed.
4. Failure vs Repair Decision Chart:
- Failure ➞ Assess ➞ Repair or Replace based on severity, application, and economic analysis.
Adapted and summarized from “Motor Life: Not a Simple Concept,” Electrical Apparatus, December 2019.